How to view Graphs & Logs
 Updated
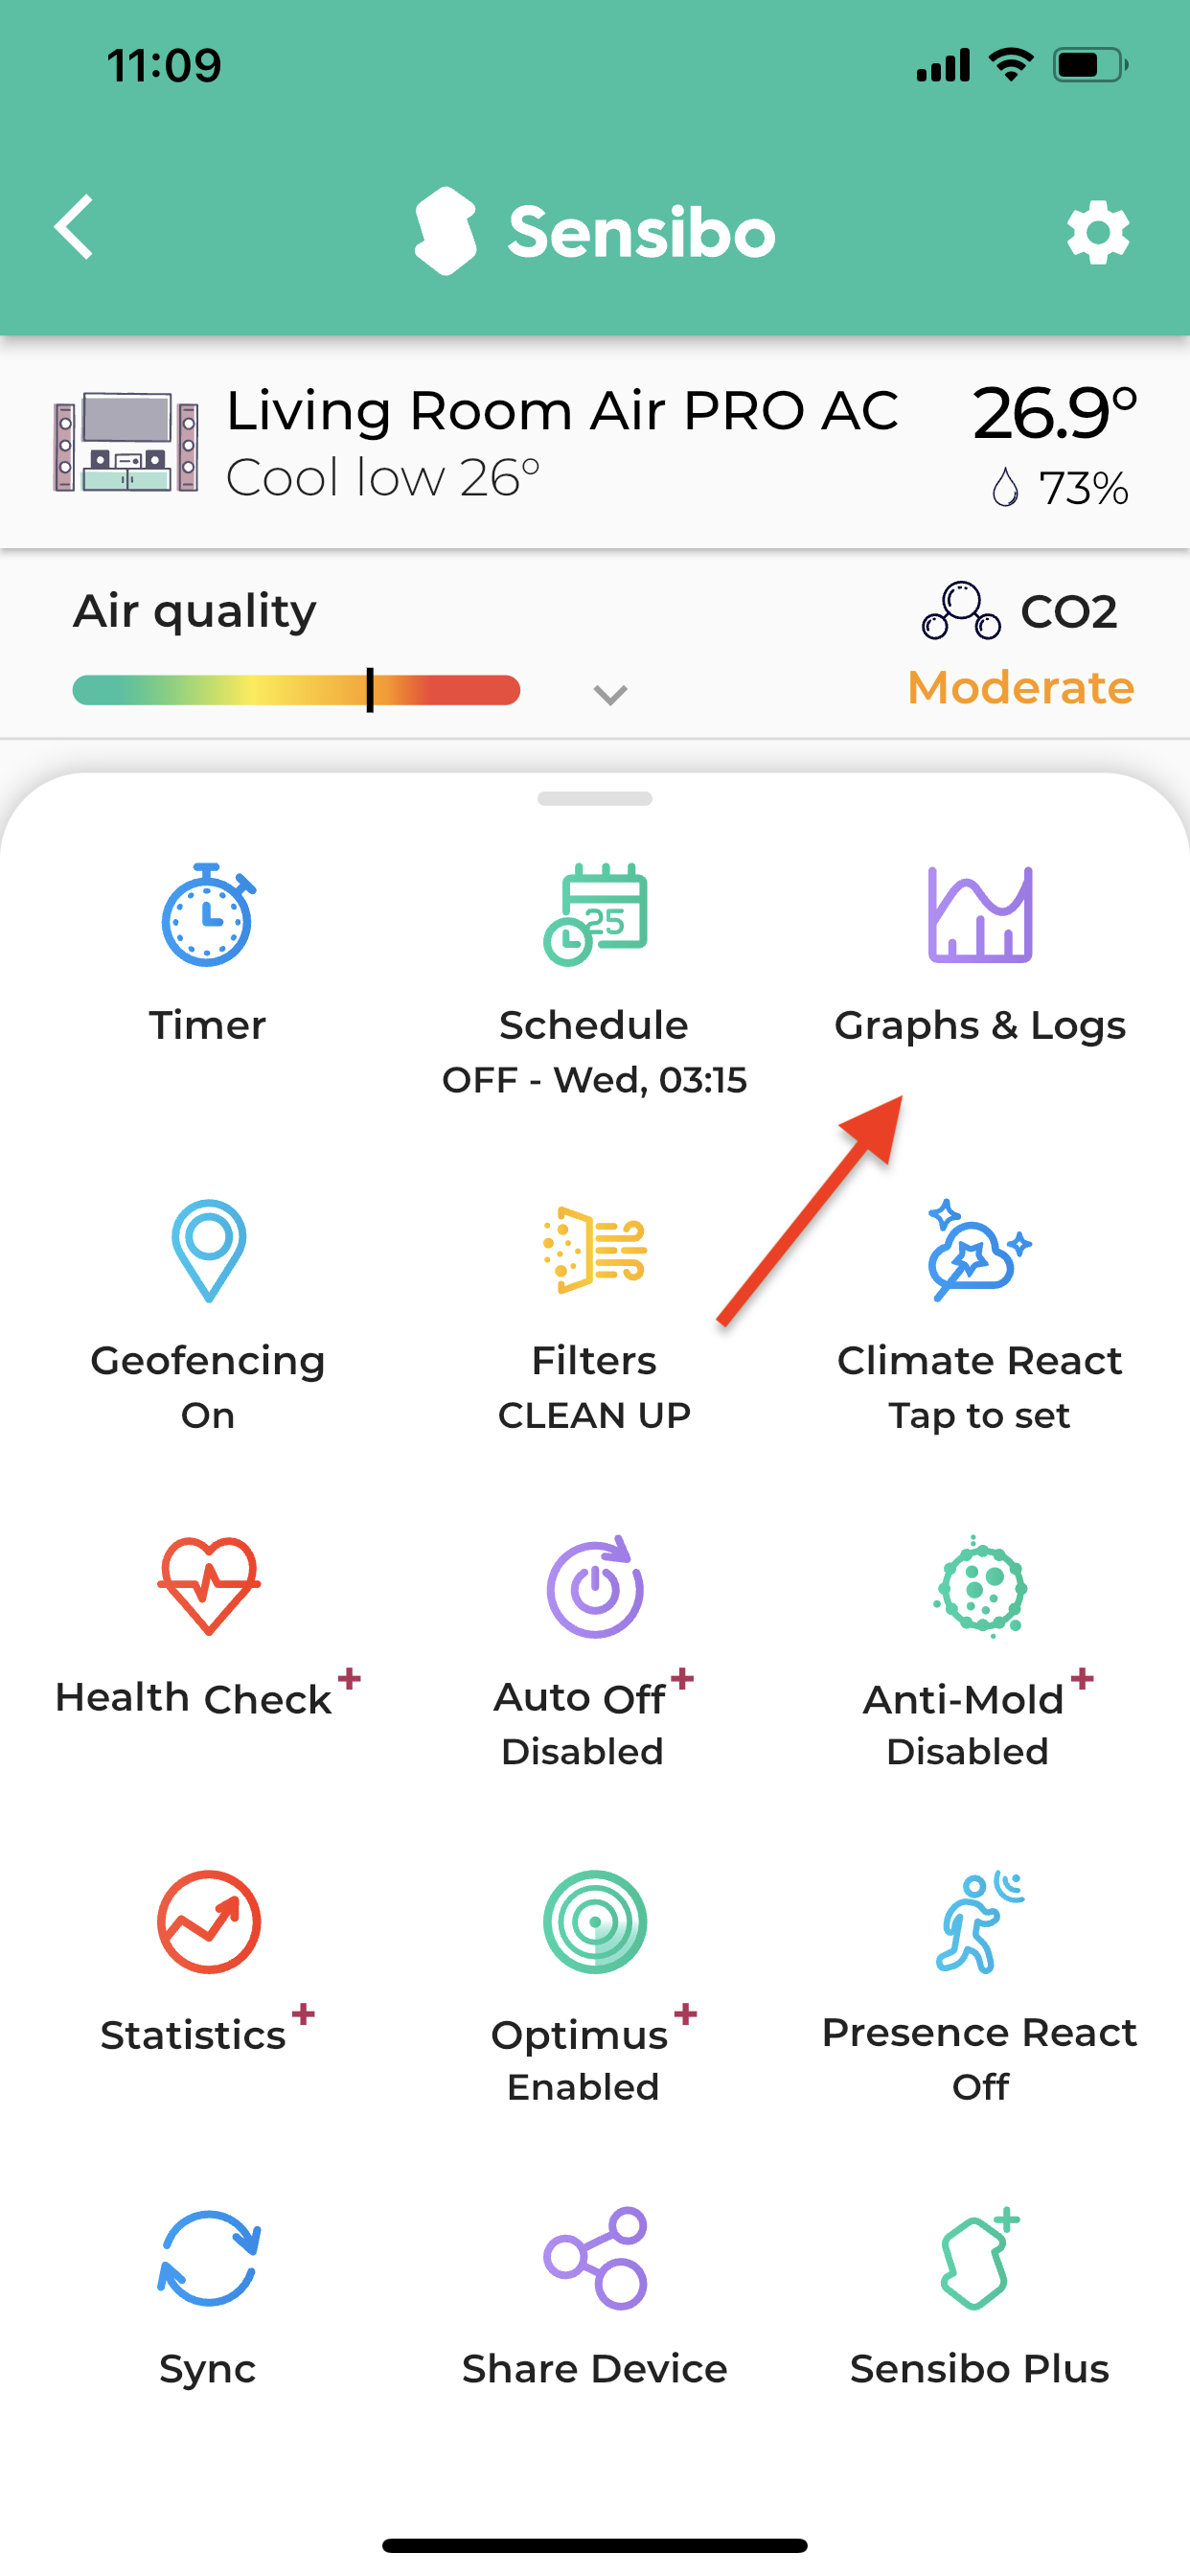
You have the ability to view Hourly and Daily Graphs by swiping up the settings drawer and by pressing Graphs & Logs
 |  |
You then can view temperature and humidity, TVOC, CO2, and outside pollution graphs by pressing on the icons. Swiping left and right on the graph itself will allow you to view specific times as well as the event log at the bottom of the screen.