Energy Saver Plan - Statistics
 Updated
Are you a numbers person? Want to optimize your AC use? Access your live AC usage statistics with the Sensibo Energy Saver Plan! Track daily, weekly, and monthly AC use and compare your usage to other Sensibo users in your area.

Live Statistics
This feature gives you live statistics about your AC usage, including daily, weekly, monthly, and yearly data. With this information, you'll be able to optimize your AC usage, save energy, and compare your usage to other Sensibo users in your area. Here are a few examples of how this feature can be put to use:
Track Your Usage
If you're trying to reduce your energy consumption, you can track your daily/weekly usage and automate your daily AC consumption. This can help you identify patterns and make adjustments to your usage to save money.

See How You Stack Up
Is your AC usage above average? If you're curious about how your AC usage compares to other users in your area, you can use the Statistics feature to see how you stack up. This can help you identify areas where you can improve your usage and save energy.

Overall, the Sensibo Energy Saver Plan is a great investment for anyone looking to make better decisions about their AC usage. With usage and statistics, you'll be able to track your AC usage and compare it to other users.
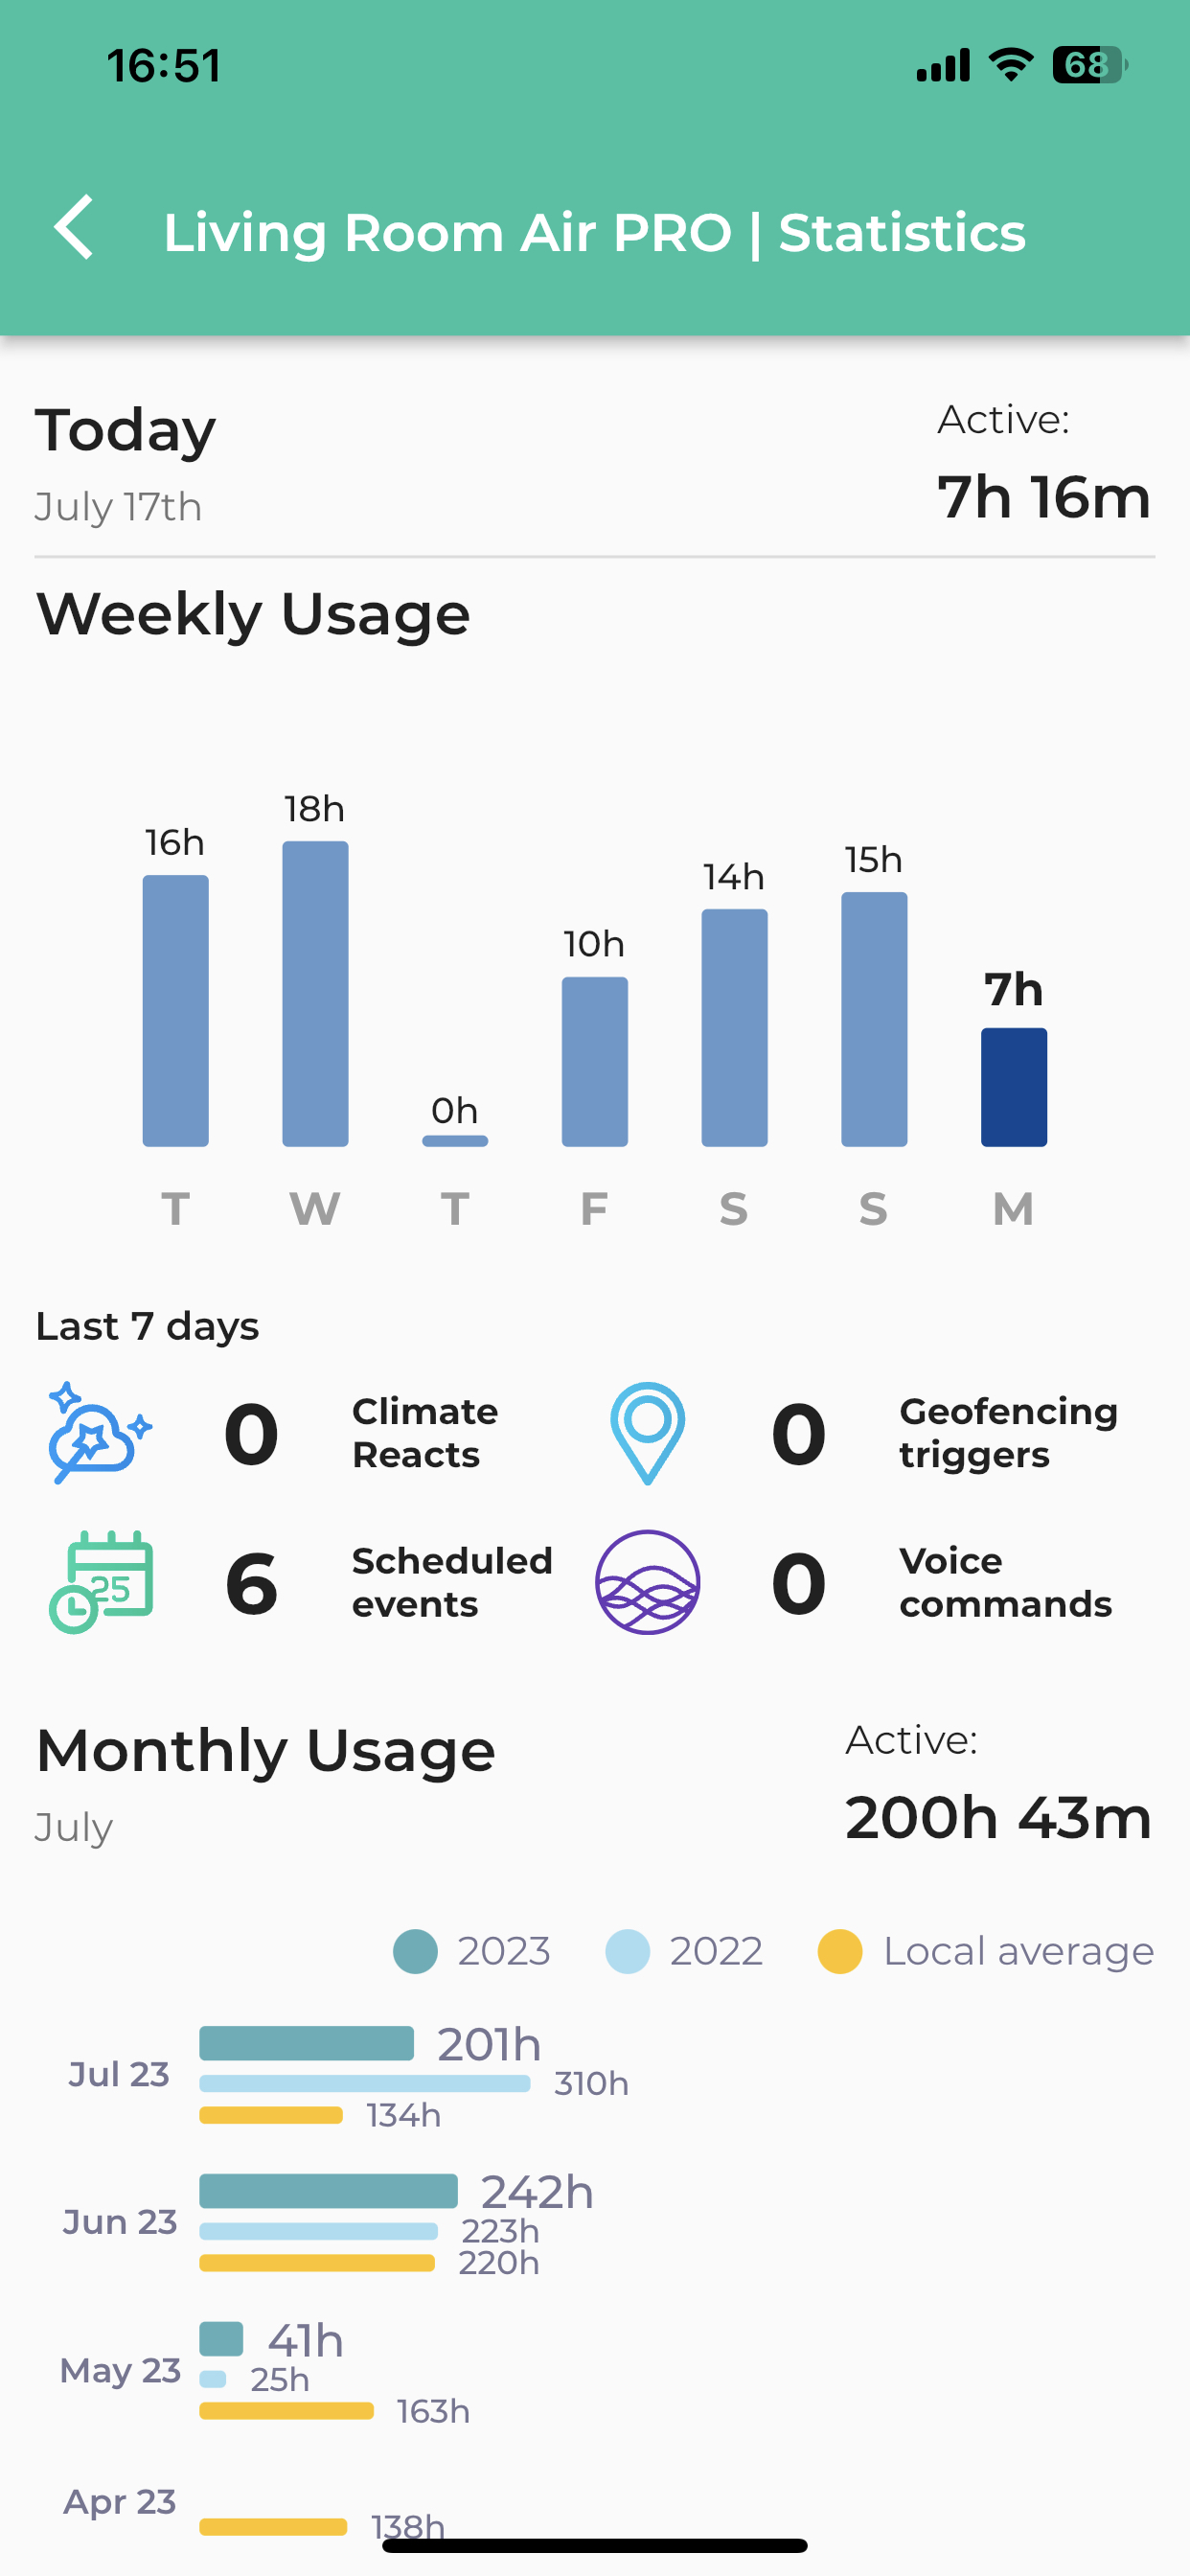
View your weekly and monthly usage including weekly triggers events as well as monthly usage compared to the previous year as well as the local average.
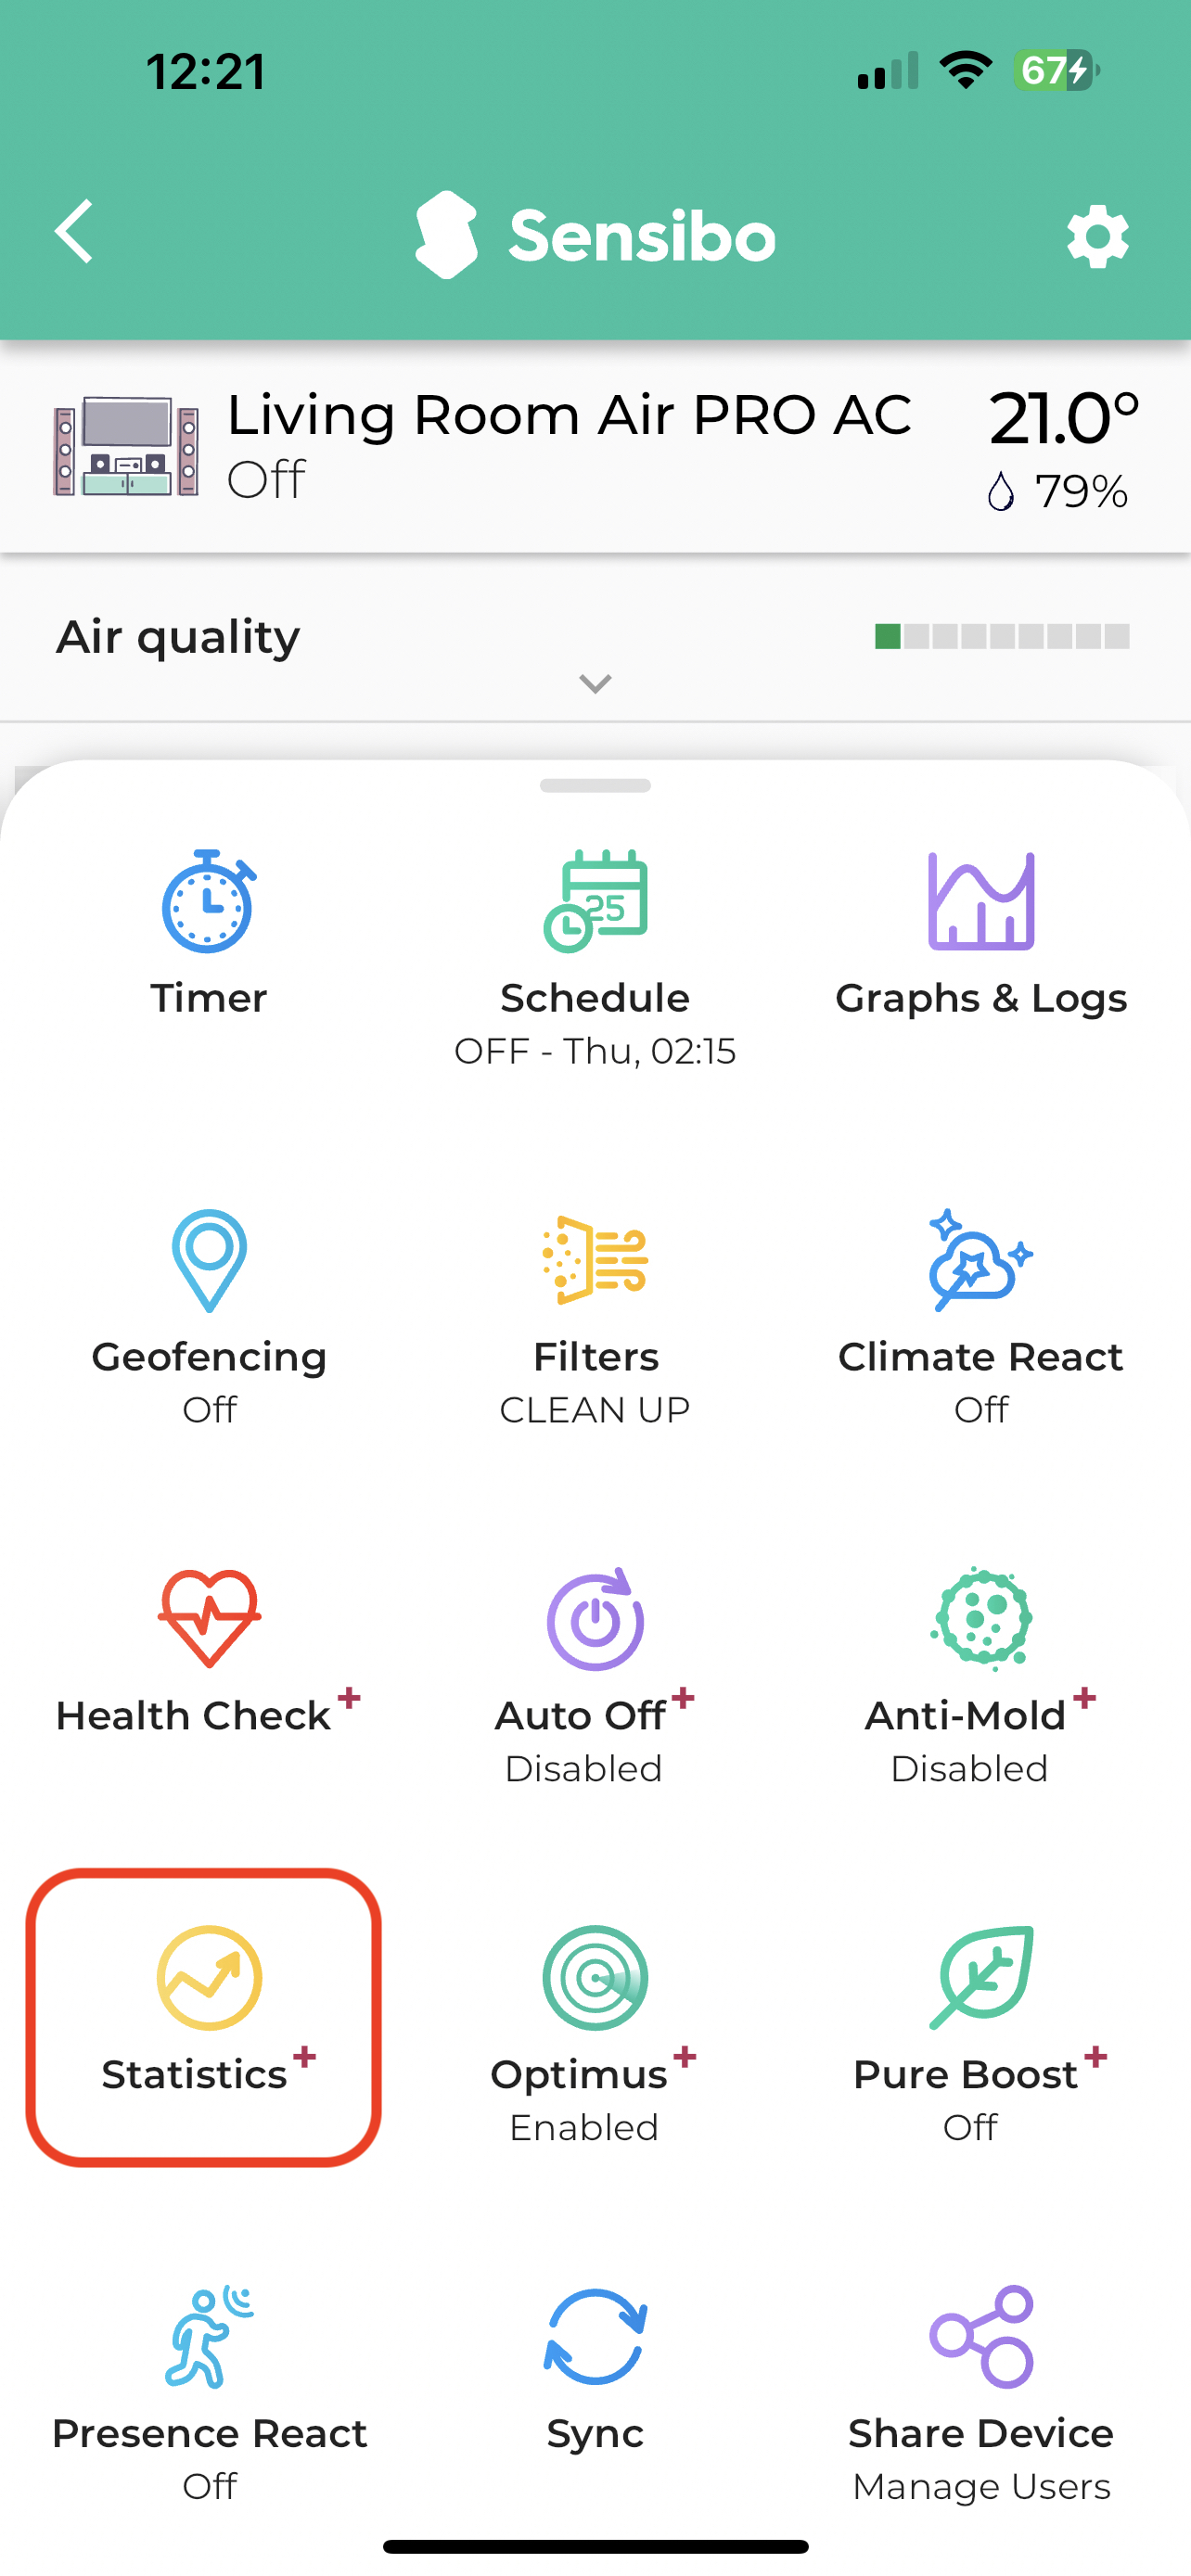
- Swipe up to open the settings drawer and select statistics
- Your weekly and monthly usage statistics appear as so